|
Zhou X, Liao H, Chern M, Yin J, Chen Y, Wang J, Zhu X, Chen Z, Yuan C, Zhao W, Wang J, Li W, He M, Ma B, Wang J, Qin P, Chen W, Wang Y, Liu J, Qian Y, Wang W, Wu X, Li P, Zhu L, Li S, Ronald PC, Chen X.
Proc Natl Acad Sci U S A. 2018 Feb 5. pii: 201705927. doi: 10.1073/pnas.1705927115. [
Abstract
Crops carrying broad-spectrum resistance loci provide an effective strategy for controlling infectious disease because these loci typically confer resistance to diverse races of a pathogen or even multiple species of pathogens. Despite their importance, only a few crop broad-spectrum resistance loci have been reported. Here, we report the identification and characterization of the rice bsr-k1 (broad-spectrum resistance Kitaake-1) mutant, which confers broad-spectrum resistance against Magnaporthe oryzae and Xanthomonas oryzae pv oryzae with no major penalty on key agronomic traits. Map-based cloning reveals that Bsr-k1 encodes a tetratricopeptide repeats (TPRs)-containing protein, which binds to mRNAs of multiple OsPAL (OsPAL1-7) genes and promotes their turnover. Loss of function of the Bsr-k1 gene leads to accumulation of OsPAL1-7 mRNAs in the bsr-k1 mutant. Furthermore, overexpression of OsPAL1 in wild-type rice TP309 confers resistance to M. oryzae, supporting the role of OsPAL1 Our discovery of the bsr-k1 allele constitutes a significant conceptual advancement and provides a valuable tool for breeding broad-spectrum resistant rice.
See: http://www.pnas.org/content/early/2018/01/30/1705927115.long
(54).png "Loss of function of a rice TPR-domain RNA-binding protein confers broad-spectrum disease resistance.")
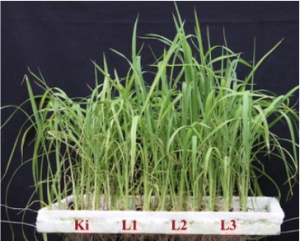
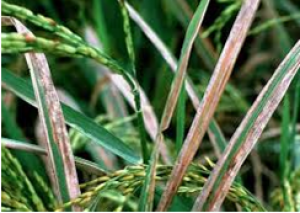
Figure 1: Phenotypic characterization of the bsr-k1 allele. (A) Field inoculation of bsr-k1 and wild-type Kitaake plants. Shown are photographs of representative plants and leaves taken 10 d postinoculation (dpi) with spore mixtures of seven Kitaake-compatible blast isolates. (Scale bar: 1 cm.) (B) Lesion lengths and numbers (mean ± SD, n > 30) after inoculation with seven Kitaake-compatible blast isolates. (C) Lesion numbers (mean ± SD, n > 30) after inoculation with seven individual blast isolates (names are given under bars). (D) Lesion lengths measured 14 dpi with 10 individual Xoo isolates (names are given below the bars). (E) Comparison of defense gene expression levels (mean ± SEM, n = 3) in bsr-k1 and Kitaake. This experiment was repeated twice with similar results. (F) Comparison of thousand-grain weights and heading dates. Error bars represent mean ± SD (n > 30). The same letter above bars indicates same statistical group (P > 0.05, Tukey’s multiple-comparison test). Asterisks indicate statistical significance (**P ≤ 0.01, t test).
|
[ Other News ]___________________________________________________
|

 Curently online :
11
Curently online :
11 Total visitors :
7451679
Total visitors :
7451679