

OsCBL10 negatively regulates salt tolerance at seedling stage in rice
Xuemei Kuang, Ruofeng Liu, Lei Jin, Shengping Wang, Shufeng Gao, Yilan Qiu
Plant Physiol Biochem.; 2026 Feb: 231:110999. doi: 10.1016/j.plaphy.2025.110999.
Abstract
Soil salinity increasingly endangers global rice production. Although CBL-CIPK complexes are known to decode salt-induced Ca2+surges to activate ion transporters and antioxidant pathways, the in vivo role of rice OsCBL10 remains unknown, leaving a critical gap in Ca2+-mediated salt-tolerance mechanisms. In this study, we demonstrate that OsCBL10 is a tonoplast-localized Ca2+sensor that is transcriptionally up-regulated by salinity and most highly expressed in anthers and salt-stressed shoots. CRISPR-Cas9 knockout lines (cbl10-1/2) exhibited higher survival, 25 % longer shoots and a 30 % lower shoot Na+/K+ ratio than wild-type (WT) plants under 100 mM NaCl, whereas over-expression lines (OE1/2) were hypersensitive. The improved tolerance of cbl10 mutants was linked to (i) enhanced Na+extrusion and K+retrieval, (ii) reduced H2O2 accumulation, and (iii) up-regulation of OsSOS1, OsNHX1 and OsMIOX. Thus, OsCBL10 functions as a tonoplast "brake" that dampens SOS signaling and ROS scavenging under salt stress. This study broadens the known roles of rice CBL proteins and highlights OsCBL10 as a key gene for engineering salt-resilient rice varieties.
See https://pubmed.ncbi.nlm.nih.gov/41483744/
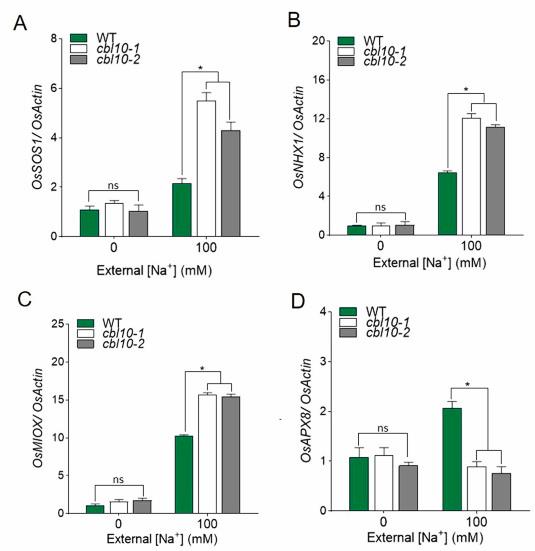
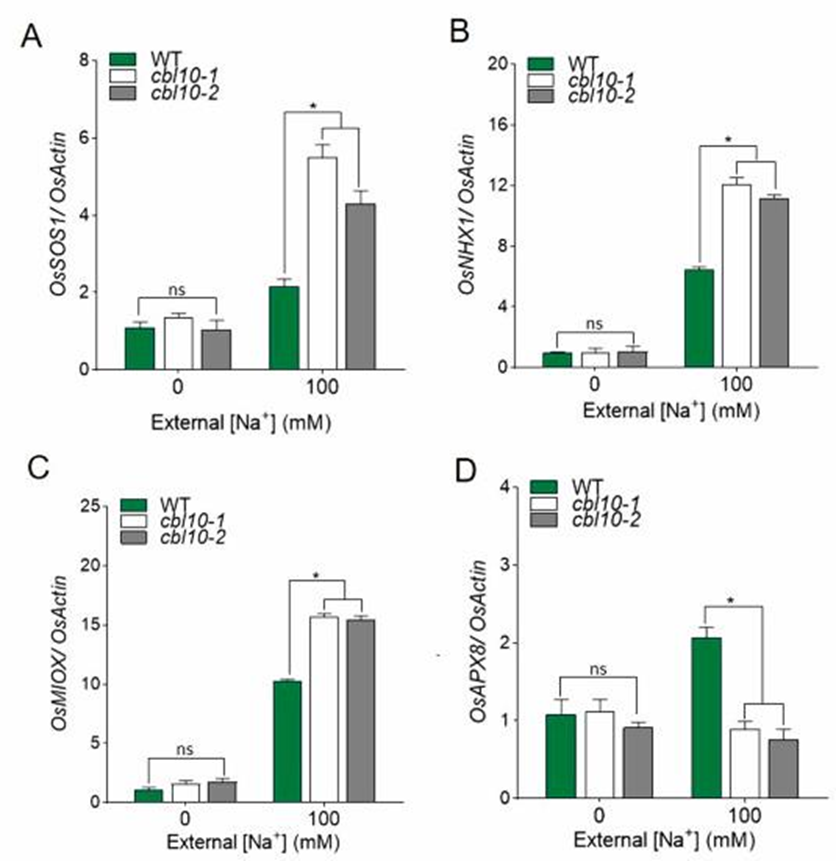
Fig. 5. Deletion of Oscbl10 affects the transcript expression of salt stress-related genes under salt stress. WT and knockout mutants (cbl10-1, cbl10-2) plants were cultured in MS hydroponic solution for 14 days, then transferred to the MS hydroponic solution supplemented with 0 or 100 mM Na+ for 24 h. (A) The expression levels of OsSOS1. (B) The expression levels of OsNHX1. (C) The expression levels OsMIOX. (D) The expression levels of OsAPX8. WT and knockout mutants showed significant differences in the transcript levels of OsSOS1, OsNHX1, OsMIOX and OsAPX8 under salt stress. The statistical analysis was carried out using one-way ANOVA. Asterisks (∗) indicate significant differences, while “ns” denotes no significant differences (p < 0.01). Error bars represent the means ± SD, n = 3.
Views: 20