

Comprehensive Evaluation of Bacterial Blight Resistance and Gene Distribution in Common Wild Rice (Oryza rufipogon) from Hainan Province, China
Xiaorong Xiao, Xiaowei Yan, Mengting Huang, Linan Zhai, Mingchao Zhao, Siyuan Huang, Bangji Zhou, Qingyu Wang, Huijian Wang, Yapeng Li, Yong Yun, Funeng Xing, Qingjie Tang
Plants (Basel); 2026 May 13; 15(10):1492. doi: 10.3390/plants15101492.
Abstract
Bacterial blight (BB), caused by Xanthomonas oryzae pv. Oryzae (Xoo), is one of the most devastating diseases in rice worldwide. Common wild rice (Oryza rufipogon Griff.) inhabiting the high-temperature and high-humidity environments of Hainan Island has evolved strong disease resistance through natural selection, representing a valuable genetic reservoir for resistance breeding. However, large-scale characterization of resistance phenotypes, resistance genes, and their combinations remains limited. In this study, we evaluated BB resistance in 1511 Hainan common wild rice accessions against three Xoo strains (HNX004, PXO99A, and Z173) and analyzed the distribution of ten major known resistance genes (Xa1, Xa3, Xa4, xa5, Xa7, Xa10, xa13, Xa21, Xa23, and Xa27). Phenotypic evaluation revealed distinct strain-specific resistance patterns. Broad-spectrum resistance analysis (defined as moderate resistance or higher) revealed that 35 accessions (2.32%) were resistant to all strains, and 378 accessions (25.02%) showed resistance to two strains. Genotyping of known resistance genes revealed that, except for one accession, which lacked all tested genes but showed resistance to strain PXO99A, all other accessions carried every tested gene except Xa21 and xa13. Interestingly, different Xoo strains exhibited distinct requirements for resistance genes, revealing a clear strain-specific resistance pattern. Notably, the number of resistance genes did not correlate with resistance level. Instead, specific complementary combinations, particularly Xa1 + Xa10 + Xa23 + Xa4 + Xa7, conferred the strongest broad-spectrum resistance. Our results demonstrate that gene quality and specific complementary combinations are more important than the absolute number of resistance genes. The identified resistant accessions and favorable gene combinations provide valuable resources for rice breeding programs.
See https://pubmed.ncbi.nlm.nih.gov/42197625/
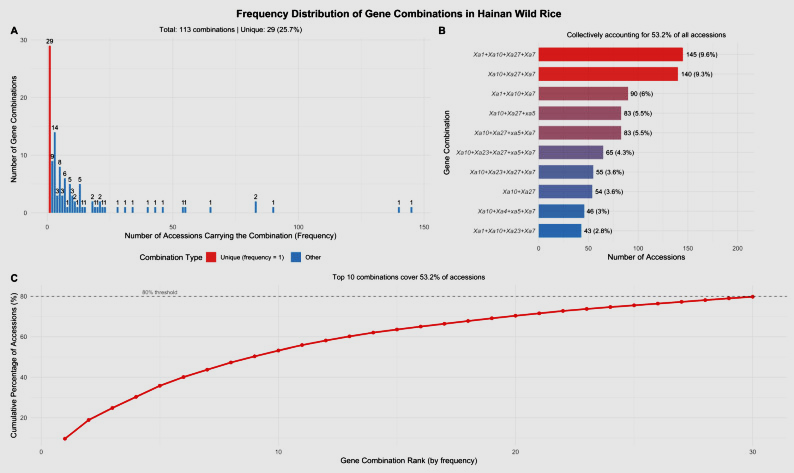
Figure 6
The frequency distribution of resistance gene combinations among 1511 Hainan common wild rice accessions. (A) A histogram of combination frequencies. Red bars represent unique combinations (frequency = 1) and blue bars represent non-unique combinations (frequency ≥ 2); numbers above bars indicate the count of combinations at each frequency level. (B) Top 10 most frequent gene combinations. The top 10 combinations collectively account for 53.2% of all accessions. Labels above bars show the frequency and percentage of total accessions. (C) A cumulative frequency distribution (Pareto chart) showing the cumulative percentage of accessions covered by combinations ranked by frequency. The red line represents the cumulative percentage, and the gray dashed line indicates the 80% threshold. Most combinations are rare or unique, reflecting the high genetic diversity of this wild rice collection.
Views: 1