| PIF7 controls leaf cell proliferation through an AN3 substitution repression mechanism |
|
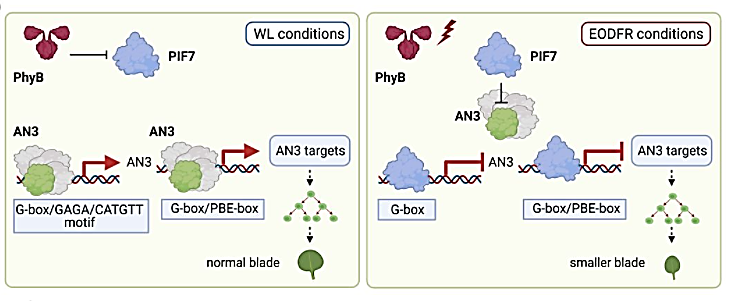
Plants are agile, plastic organisms able to adapt to everchanging circumstances. Responding to far-red (FR) wavelengths from nearby vegetation, shade-intolerant species elicit the adaptive shade-avoidance syndrome (SAS), characterized by elongated petioles, leaf hyponasty, and smaller leaves. We utilized end-of-day FR (EODFR) treatments to interrogate molecular processes that underlie the SAS leaf response. Genetic analysis established that PHYTOCHROME-INTERACTING FACTOR 7 (PIF7) is required for EODFR-mediated constraint of leaf blade cell division, while EODFR messenger RNA sequencing data identified ANGUSTIFOLIA3 (AN3) as a potential PIF7 target. |
|
PNAS February 1, 2022 119 (5) e2115682119
SignificancePhytochrome photoreceptors can markedly alter leaf blade growth in response to far-red (FR) rich neighbor shade, yet we have a limited understanding of how this is accomplished. This study identifies ANGUSTIFOLIA3 (AN3) as a central component in phytochrome promotion of leaf cell proliferation and PHYTOCHROME-INTERACTING FACTOR 7 (PIF7) as a potent repressor. AN3 and PIF7 impose opposing regulation on a shared suite of genes through common cis-acting promoter elements. In response to FR light, activated PIF7 blocks AN3 action by evicting and substituting for AN3 at target promoters. This molecular switch module provides a mechanism through which changes in external light quality can dynamically manipulate gene expression, cell division, and leaf size. AbstractPlants are agile, plastic organisms able to adapt to everchanging circumstances. Responding to far-red (FR) wavelengths from nearby vegetation, shade-intolerant species elicit the adaptive shade-avoidance syndrome (SAS), characterized by elongated petioles, leaf hyponasty, and smaller leaves. We utilized end-of-day FR (EODFR) treatments to interrogate molecular processes that underlie the SAS leaf response. Genetic analysis established that PHYTOCHROME-INTERACTING FACTOR 7 (PIF7) is required for EODFR-mediated constraint of leaf blade cell division, while EODFR messenger RNA sequencing data identified ANGUSTIFOLIA3 (AN3) as a potential PIF7 target. We show that PIF7 can suppress AN3 transcription by directly interacting with and sequestering AN3. We also establish that PIF7 and AN3 impose antagonistic control of gene expression via common cis-acting promoter motifs in several cell-cycle regulator genes. EODFR triggers the molecular substitution of AN3 to PIF7 at G-box/PBE-box promoter regions and a switch from promotion to repression of gene expression.
See: https://www.pnas.org/content/119/5/e2115682119
Fig. 1. EODFR inhibits cell division during distinct phases of leaf development. (A) Schematic representation of L3 development and the light treatment regime. The green arrow indicates the period of L3 development, days are shown above a series of white and black rectangles representing 12:12-h day–night cycles. L3 emergence occurs at day 8, full blade expansion at day 28, and samples were taken on day 34. The WL arrow indicates control 12L:12D conditions, red arrows show the different treatment periods during which the plants received daily EODFR for 10 min after dusk. (B) L3 blade area (B), epidermal (C–E), and palisade (F–H) cell number, size, and cell density in plants subject to EODFR for days 6 to 10, 10 to 14, 14 to 18, 6 to 18, or 6 to 34. Box plot central lines represent the mean, and whiskers show minimum and maximum values. Different letters denote statistically significant differences between treatments from one-way ANOVA followed by Tukey’s post hoc test, P < 0.0001 (B, C, and F); P < 0.6200 (D), P < 0.8435 (G); P < 0.6023 (E), P < 0.9604 (H), (n > 20 blades, ∼27 cells per blade). Experiments were replicated at least three times with similar results. |
|
|
|
[ Tin tức liên quan ]___________________________________________________
|


 Curently online :
 Total visitors :
 Ejaz Hussain, Andrés Romanowski, and Karen J. Halliday
.png)
