|
Liu C, Ou S, Mao B, Tang J, Wang W, Wang H, Cao S, Schläppi MR, Zhao B, Xiao G, Wang X, Chu C.
Nat Commun. 2018 Aug 17; 9(1):3302. doi: 10.1038/s41467-018-05753-w.
Abstract
Cold stress is a major factor limiting production and geographic distribution of rice (Oryza sativa). Although the growth range of japonica subspecies has expanded northward compared to modern wild rice (O. rufipogon), the molecular basis of the adaptation remains unclear. Here we report bZIP73, a bZIP transcription factor-coding gene with only one functional polymorphism (+511G>A) between the two subspecies japonica and indica, may have facilitated japonica adaptation to cold climates. We show the japonica version of bZIP73 (bZIP73Jap) interacts with bZIP71 and modulates ABA levels and ROS homeostasis. Evolutionary and population genetic analyses suggest bZIP73 has undergone balancing selection; the bZIP73Jap allele has firstly selected from standing variations in wild rice and likely facilitated cold climate adaptation during initial japonica domestication, while the indica allele bZIP73Ind was subsequently selected for reasons that remain unclear. Our findings reveal early selection of bZIP73Jap may have facilitated climate adaptation of primitive rice germplasms.
See: https://www.ncbi.nlm.nih.gov/pubmed/30120236
(41).png "Early selection of bZIP73 facilitated adaptation of japonica rice to cold climates.")
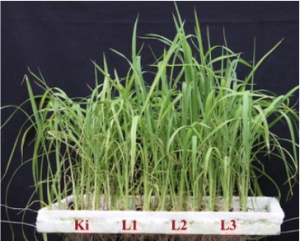
Figure 1:
Assessment of cold stress tolerance of bZIP73 and bZIP71 transgenic rice. a Overexpression lines bZIP73Jap (73JapOE), bZIP73Ind (73IndOE), and bZIP71 (71OE), co-expression lines bZIP71-bZIP73Jap (71–73JapOE), and RNAi lines bZIP73Jap (73JapRi) and bZIP71 (71Ri) were cold treated at 4°C for 3 days and are shown after recovery at 28°C for 7 days. ZH11, wild-type Zhonghua 11. b Survival rates of ZH11 and transgenic lines recovered after cold treatment. Scale bars, 5cm. c Relative expression levels of bZIP73 and bZIP71 in ZH11 and transgenic lines measured by real-time PCR under normal condition. Target genes for measurement are indicated on top of the plot, and expression levels in ZH11 (wild-type plants) was used as reference (1×) to show expression fold change (y-axes) in transgenic lines as indicated on x-axes. Due to the different scale of relative expression levels, data were separated into three subplots. All data were collected using two independent homozygous lines indicated on x-axes with three biological replicates (n=288 each). Error bar, standard deviation; **p<0.01, two-tailed t-test in comparison to ZH11.
|
[ Other News ]___________________________________________________
|

 Curently online :
4
Curently online :
4 Total visitors :
7515857
Total visitors :
7515857