|
Hwang JE, Jang DS, Lee KJ, Ahn JW, Kim SH, Kang SY, Kim DS, Kim JB.
Genes Genet Syst. 2016 Sep 1. [Epub ahead of print] DOI: 10.1266/ggs.15-00052
Abstract
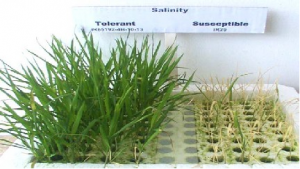
A high-salt environment represents environmental stress for most plants. Those that can grow and thrive in such an environment must have membrane transport systems that can respond effectively. Plant roots absorb Na+ from the soil, and the plant must maintain Na+ homeostasis to survive salt stress. A major mechanism by which salt-tolerant plants adapt to salt stress is through modulation of ion transport genes. We have subjected a population of rice plants to mutagenesis, and identified lines with both single-nucleotide polymorphisms (SNPs) in membrane transport genes and altered responses to salt stress. Primers labeled with FAM or HEX fluorescent dyes were designed for nine target genes encoding membrane transport proteins that are believed to regulate salt stress tolerance. A TILLING (Targeting Induced Local Lesions IN Genome) assay was performed on 2,961 M2 rice mutant lines using electrophoresis. After the TILLING assay, a total of 41 mutant lines containing SNPs in the target genes were identified and screened. The average number of mutations per gene was 1/492 kb in lines having SNPs, and the percentage of mutation sites per total sequence was 0.67. Among the 41 lines, nine had altered sequences in the exon region of the genes. Of these nine lines, seven were tolerant to salt stress after exposure to 170 mM NaCl for three weeks, while the other two lines were not more salt-tolerant than the control lines. Furthermore, five mutant lines containing SNPs in the coding region of OsAKT1, OsHKT6, OsNSCC2, OsHAK11 and OsSOS1 showed changed expression levels for each gene. We conclude that variation in membrane transport genes, such as expression levels and protein structures, may affect the rice plant's tolerance to salt stress. These mutations represent traits that may be selected for large rice mutant populations, permitting efficient acquisition of salt-tolerant lines.
See: https://www.ncbi.nlm.nih.gov/pubmed/27582185
(14).png "Identification of gamma ray irradiation-induced mutations in membrane transport genes in a rice population by TILLING.")
Figure 2: The position of the SNP that was detected in each target gene. A blue line indicates the target gene and there are various SNPs within the blue lines. The position of the SNPs and the phase of the mutated sequence are marked with a number and letter, respectively. The red square boxes represent exons of the genes and the red letters indicate SNPs located within the exons. An asterisk indicates the position of SNPs commonly detected in some lines.
|
[ Other News ]___________________________________________________
|


 Curently online :
8
Curently online :
8 Total visitors :
7515748
Total visitors :
7515748