|
Meng Q, Gupta R, Kwon SJ, Wang Y, Agrawal GK, Rakwal R, Park SR, Kim ST.
Plant Pathol J. 2018 Aug;34(4):257-268. doi: 10.5423/PPJ.OA.01.2018.0008. Epub 2018 Aug 1.
Abstract
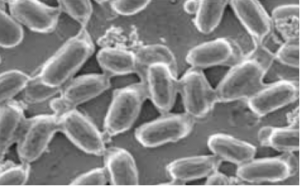
Rice blast disease, caused by Magnaporthe oryzae, results in an extensive loss of rice productivity. Previously, we identified a novel M. oryzae secreted protein, termed MSP1 which causes cell death and pathogen-associated molecular pattern (PAMP)-triggered immune (PTI) responses in rice. Here, we report the transcriptome profile of MSP1-induced response in rice, which led to the identification of 21,619 genes, among which 4,386 showed significant changes (P < 0.05 and fold change > 2 or < 1/2) in response to exogenous MSP1 treatment. Functional annotation of differentially regulated genes showed that the suppressed genes were deeply associated with photosynthesis, secondary metabolism, lipid synthesis, and protein synthesis, while the induced genes were involved in lipid degradation, protein degradation, and signaling. Moreover, expression of genes encoding receptor-like kinases, MAPKs, WRKYs, hormone signaling proteins and pathogenesis-related (PR) proteins were also induced by MSP1. Mapping these differentially expressed genes onto various pathways revealed critical information about the MSP1-triggered responses, providing new insights into the molecular mechanism and components of MSP1-triggered PTI responses in rice.
See https://www.ncbi.nlm.nih.gov/pubmed/30140180
(37).png "Transcriptomic Analysis of Oryza sativa Leaves Reveals Key Changes in Response to Magnaporthe oryzae MSP1.")
Figure 1: Distribution of differentially expressed genes (DEGs) in response to MSP1 in rice leaves. M6, MSP1 treated sample harvested at 6 hpt; M24, MSP1 treated sample harvested at 24 hpt. (A) Diagrams showing an overview of DEGs in response to MSP1 at 6 hpt and 24 hpt. (B) Numbers of up-regulated and down-regulated DEGs in response to MSP1. (C) Numbers of DEGs with different fold change range. (D) Diagram showing distribution of significantly up-regulated genes and down-regulated genes at 6 hpt and 24 hpt. (E) Gene set enrichment analysis using the Pageman web-tool showed up- and down-regulated pathways at transcriptomics level in response to MSP1 treatment. A full list of data is given in supplementary Table 2.
|
[ Other News ]___________________________________________________
|


 Curently online :
4
Curently online :
4 Total visitors :
7515857
Total visitors :
7515857