|

 Curently online :
8 Curently online :
8 |
|
 Total visitors :
7515345 Total visitors :
7515345 |
|
|
Efficient Genome-Wide Sequencing and Low-Coverage Pedigree Analysis from Noninvasively Collected Samples
Thursday, 2016/06/09 | 08:15:43
|
|
Noah Snyder-Mackler, William H. Majoros, Michael L. Yuan, Amanda O. Shaver, Jacob B. Gordon, Gisela H. Kopp, Stephen A. Schlebusch, Jeffrey D. Wall, Susan C. Alberts, Sayan Mukherjee, Xiang Zhou, and Jenny Tung Genetics June 2016 203:699-714 AbstractResearch on the genetics of natural populations was revolutionized in the 1990s by methods for genotyping noninvasively collected samples. However, these methods have remained largely unchanged for the past 20 years and lag far behind the genomics era. To close this gap, here we report an optimized laboratory protocol for genome-wide capture of endogenous DNA from noninvasively collected samples, coupled with a novel computational approach to reconstruct pedigree links from the resulting low-coverage data. We validated both methods using fecal samples from 62 wild baboons, including 48 from an independently constructed extended pedigree. We enriched fecal-derived DNA samples up to 40-fold for endogenous baboon DNA and reconstructed near-perfect pedigree relationships even with extremely low-coverage sequencing. We anticipate that these methods will be broadly applicable to the many research systems for which only noninvasive samples are available. The lab protocol and software (“WHODAD”) are freely available at www.tung-lab.org/protocols-and-software.html and www.xzlab.org/software.html, respectively.
See: http://www.genetics.org/content/203/2/699?etoc
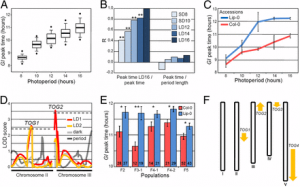
Figure 2 fDNA enrichment results. (A) Percentage of sequencing reads that mapped to the baboon genome and were not PCR duplicates (“Mapped,” dark blue), mapped and were PCR duplicates (“PCR Duplicate,” blue), or did not map and likely represent environmental or bacterial DNA in the case of fDNA/aDNA and unmappable fragments in the case of gDNA (“Other,” light blue). “gDNA” represents genomic DNA derived from the blood samples for LIT and HAP; “aDNA” represents ancient DNA data from capture-based enrichment reported in Carpenter et al. (2013). Numbers above each bar show the total number of PCR cycles used in each protocol. (B) Capture 2 produced significantly greater genome coverage than capture 1, despite a similar number of reads generated per sample (two-sample t-test, T = 9.7, P = 3.0 × 10⁻¹²). On average in capture 2, we obtained ∼0.73× coverage of the genome with 5.76 Gb of sequencing. If all 5.76 Gb mapped to the baboon genome as non-PCR duplicates, we would have produced ∼2.2× genome-wide coverage. (C) Capture 2 also produced significantly greater fold enrichment of baboon DNA (fold enrichment is measured as percentage of nonduplicate baboon DNA postcapture divided by percentage of baboon DNA precapture: two-sample t-test, T = 4.4, P = 7.3 × 10⁻⁵). (D) The amount of baboon DNA in the sample precapture [percentage of baboon DNA precapture, based on qPCR of the single-copy c-myc gene (Morin et al. 2001)] is strongly correlated with the percentage of baboon fragments obtained in postenrichment sequencing (Pearson’s r = 0.80, P = 1.0 × 10⁻¹¹). However, even samples with low amounts of endogenous DNA (<2%) exhibit substantial fold enrichment using our protocol (meancapture1 = 10.60×, meancapture2 = 24.82×). |
|
|
|
[ Other News ]___________________________________________________
|
(36).png "Efficient Genome-Wide Sequencing and Low-Coverage Pedigree Analysis from Noninvasively Collected Samples")