|
Cathrine Kiel Skovbjerg, Deepti Angra, Tom Robertson-Shersby-Harvie, Jonathan Kreplak, Gabriel Keeble-Gagnère, Sukhjiwan Kaur, Wolfgang Ecke, Alex Windhorst, Linda Kærgaard Nielsen, Andrea Schiemann, Jens Knudsen, Natalia Gutierrez, Vasiliki Tagkouli, Lavinia Ioana Fechete, Luc Janss, Jens Stougaard, Ahmed Warsame, Sheila Alves, Hamid Khazaei, Wolfgang Link, Ana Maria Torres, Donal Martin O’Sullivan & Stig Uggerhøj Andersen
Theoretical and Applied Genetics May 2023; vol. 136, Article number: 114
Key message
We identified marker-trait associations for key faba bean agronomic traits and genomic signatures of selection within a global germplasm collection.
Abstract
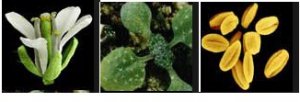
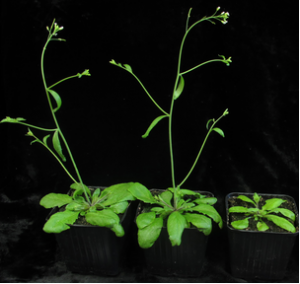
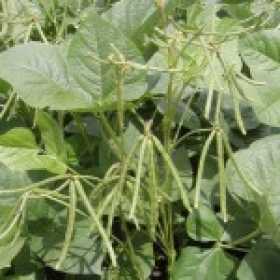
Faba bean (Vicia faba L.) is a high-protein grain legume crop with great potential for sustainable protein production. However, little is known about the genetics underlying trait diversity. In this study, we used 21,345 high-quality SNP markers to genetically characterize 2678 faba bean genotypes. We performed genome-wide association studies of key agronomic traits using a seven-parent-MAGIC population and detected 238 significant marker-trait associations linked to 12 traits of agronomic importance. Sixty-five of these were stable across multiple environments. Using a non-redundant diversity panel of 685 accessions from 52 countries, we identified three subpopulations differentiated by geographical origin and 33 genomic regions subjected to strong diversifying selection between subpopulations. We found that SNP markers associated with the differentiation of northern and southern accessions explained a significant proportion of agronomic trait variance in the seven-parent-MAGIC population, suggesting that some of these traits were targets of selection during breeding. Our findings point to genomic regions associated with important agronomic traits and selection, facilitating faba bean genomics-based breeding.
See https://link.springer.com/article/10.1007/s00122-023-04360-8
(131).png "Genetic analysis of global faba bean diversity, agronomic traits and selection signatures")
Figure 1: Genetic structure of individual panels. A Folded size frequency spectrums of the eight panels show the panel-wise distribution of minor allele counts (MAC). B Panel-wise LD decay plots. Y-axis displays the average squared correlation coefficient (R2) between markers when sorted after the average distance and binned into groups of 1000 or 5000 seven-parent-MAGIC and four-way-cross). For each bin, the x-axis displays the average distance in Mbp between two SNPs. The green line is the fitted loess curve with half its maximum R2 indicated by the dashed line
|
[ Other News ]___________________________________________________
|

 Curently online :
65
Curently online :
65 Total visitors :
7654265
Total visitors :
7654265