|

 Curently online :
23 Curently online :
23 |
|
 Total visitors :
7656331 Total visitors :
7656331 |
|
|
Identification and validation of a key genomic region on chromosome 6 for resistance to Fusarium stalk rot in tropical maize
Saturday, 2022/12/17 | 08:22:27
|
|
Zerka Rashid, Veerendra Babu, Shyam Sundar Sharma, Pradeep Kumar Singh & Sudha Krishnan Nair Theoretical and Applied Genetics December 2022; vol. 135: 4549–4563 Key messageA key genomic region was identified for resistance to FSR at 168 Mb on chromosome 6 in GWAS and haplotype regression analysis, which was validated by QTL mapping in two populations. AbstractFusarium stalk rot (FSR) of maize is an economically important post-flowering stalk rot (PFSR) disease caused by Fusarium verticillioides. The pathogen invades the plant individually, or in combination with other stalk rot pathogens or secondary colonizers, thereby making it difficult to make accurate selection for resistance. For identification and validation of genomic regions associated with FSR resistance, a genome-wide association study (GWAS) was conducted with 342 maize lines. The panel was screened for FSR in three environments using standard artificial inoculation methodology. GWAS using the mixed linear model corrected for population structure and kinship was done, in which 290,626 SNPs from genotyping-by-sequencing were used. A total of 7 SNPs, five on chromosome 6 showing strong LD at 168 Mb, were identified to be associated with FSR. Haplotype regression analysis identified 32 haplotypes with a significant effect on the trait. In a QTL mapping experiment in two populations for validating the identified variants, QTLs were identified with confidence intervals having overlapped physical coordinates in both the populations on chromosome 6, which was closely located to the GWAS-identified variants on chromosome 6. It makes this genomic region a crucial one to further investigate the possibility of developing trait markers for deployment in breeding pipelines. It was noted that previously reported QTLs for other stalk rots in maize mapped within the same physical intervals of several haplotypes identified for FSR resistance in this study. The possibility of QTLs controlling broad-spectrum resistance for PFSR in general requires further investigation.
See https://link.springer.com/article/10.1007/s00122-022-04239-0
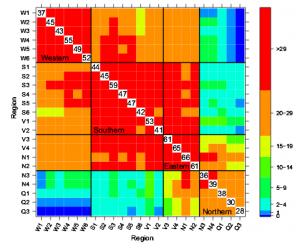
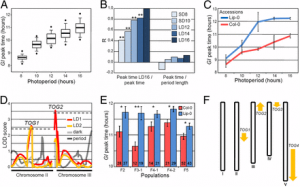
Figure 3: a Manhattan plots from GWAS analysis using MLM model, plotted with the individual SNPs on 10 chromosomes on the X-axis and −log10 P- value of each SNP on the Y-axis. The horizontal line showed the cut-off p value and the vertical lines represent the identified QTLs (orange) and haplotype blocks (yellow) in these regions for Fusarium stalk rot resistance. b: Local Manhattan plot at the peak observed on Chromosome 6 between 168.43 and 168.81 Mb. c: LD Heat map representing pairwise r2 values between the SNPs above P value threshold at the observed peak on chromosome 6. |
|
|
|
[ Other News ]___________________________________________________
|
(253).png "Identification and validation of a key genomic region on chromosome 6 for resistance to Fusarium stalk rot in tropical maize")