|

 Curently online :
54 Curently online :
54 |
|
 Total visitors :
7655300 Total visitors :
7655300 |
|
|
Plasticity of maternal environment-dependent expression-QTLs of tomato seeds
Thursday, 2023/02/23 | 07:57:32
|
|
Mark G. Sterken, Harm Nijveen, Martijn van Zanten, Jose M. Jiménez-Gómez, Nafiseh Geshnizjani, Leo A. J. Willems, Juriaan Rienstra, Henk W. M. Hilhorst, Wilco Ligterink & Basten L. Snoek Theoretical and Applied Genetics volume 136, Article number: 5 (2023); Published: 22 February 2023 AbstractSeeds are essential for plant reproduction, survival, and dispersal. Germination ability and successful establishment of young seedlings strongly depend on seed quality and on environmental factors such as nutrient availability. In tomato (Solanum lycopersicum) and many other species, seed quality and seedling establishment characteristics are determined by genetic variation, as well as the maternal environment in which the seeds develop and mature. The genetic contribution to variation in seed and seedling quality traits and environmental responsiveness can be estimated at transcriptome level in the dry seed by mapping genomic loci that affect gene expression (expression QTLs) in contrasting maternal environments. In this study, we applied RNA-sequencing to construct a linkage map and measure gene expression of seeds of a tomato recombinant inbred line (RIL) population derived from a cross between S. lycopersicum (cv. Moneymaker) and S. pimpinellifolium (G1.1554). The seeds matured on plants cultivated under different nutritional environments, i.e., on high phosphorus or low nitrogen. The obtained single-nucleotide polymorphisms (SNPs) were subsequently used to construct a genetic map. We show how the genetic landscape of plasticity in gene regulation in dry seeds is affected by the maternal nutrient environment. The combined information on natural genetic variation mediating (variation in) responsiveness to the environment may contribute to knowledge-based breeding programs aiming to develop crop cultivars that are resilient to stressful environments.
See https://link.springer.com/article/10.1007/s00122-023-04322-0
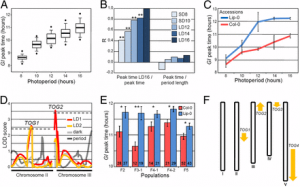
Figure 1: a Genetic map showing the genotypes of the RILs that were included in the low nitrogen (LN) treatment experiment. The map represents the most probable genotype per marker location. Yellow indicates MM; brown indicates PI. Position on the chromosome is indicated in centimorgans (cM). b As in (a), but for the RILs that were included in the high phosphorous (HP) treatment experiment. c Recombination events per chromosome for the whole population (black) and the LN-(orange) and HP-treated (green) sub-populations. The physical position is given on the x-axis in million bases (Mb); the genetic position is given on the y-axis in centimorgans (cM). Chromosome numbers are indicated above panels (color figure online)
|
|
|
|
[ Other News ]___________________________________________________
|
(200).png "Plasticity of maternal environment-dependent expression-QTLs of tomato seeds")